Cell Count Threshold Selection
Before variants of interest can be selected, a threshold for the
number of sample cells for potential variants of interest. In
order to get a rough idea of the cell count vs variant count
distribution (i.e. how many variants have a given number of)
cells, I first plotted the the distribution of the number of
sample cells for each variant. In order to do this as well as
future analysis, I first generated a "variant count file" using
the data in
DINO_ViT_genotypes_PCA12_chsep_ImageNet3channel_scaled_bothreps_053124.csv
. This was generated using
fisseqtools.feature_selection dump_barcode_count.
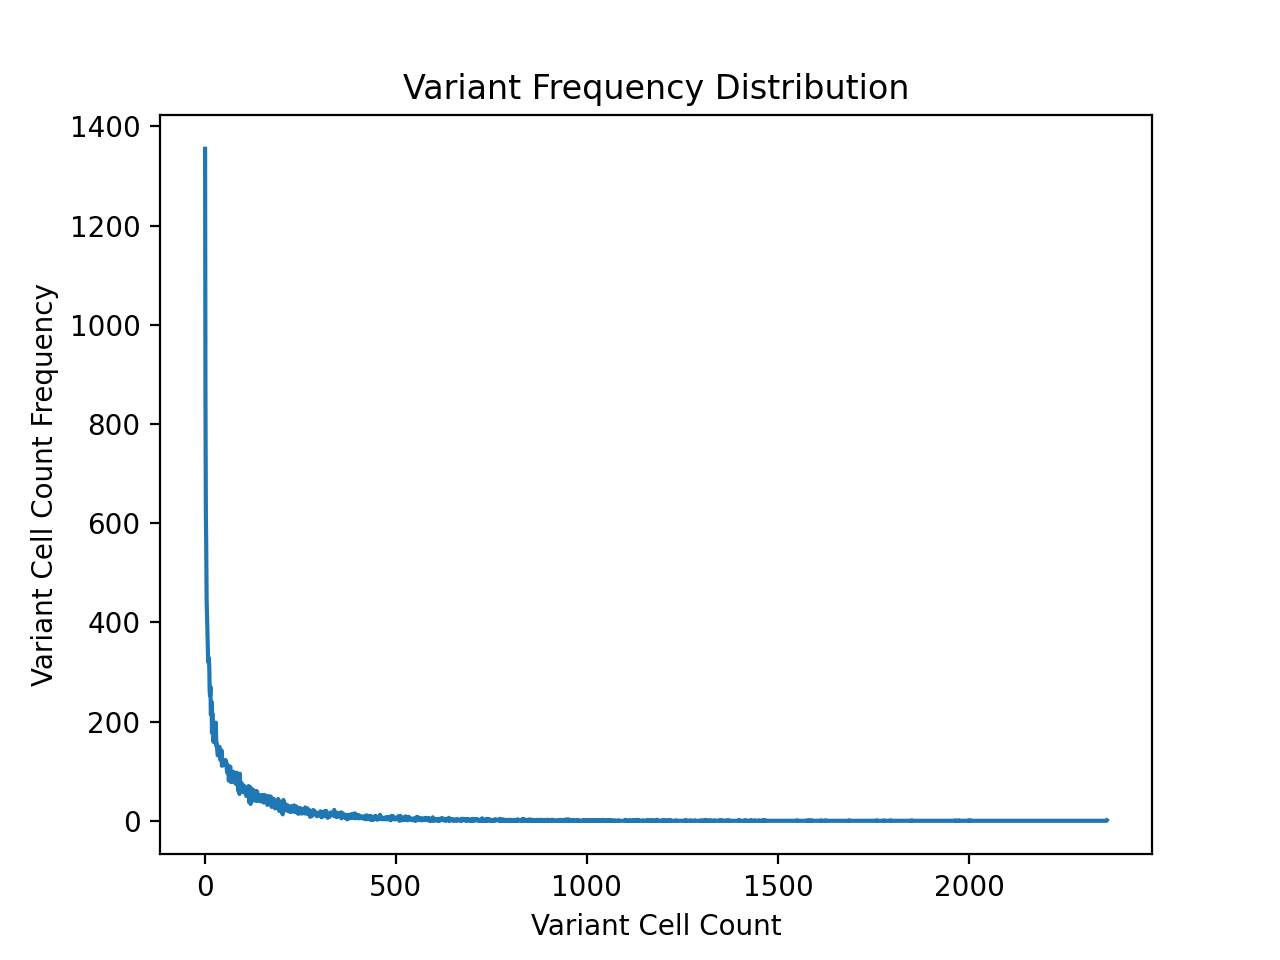
As expected, the cell counts are roughly exponentially distributed.
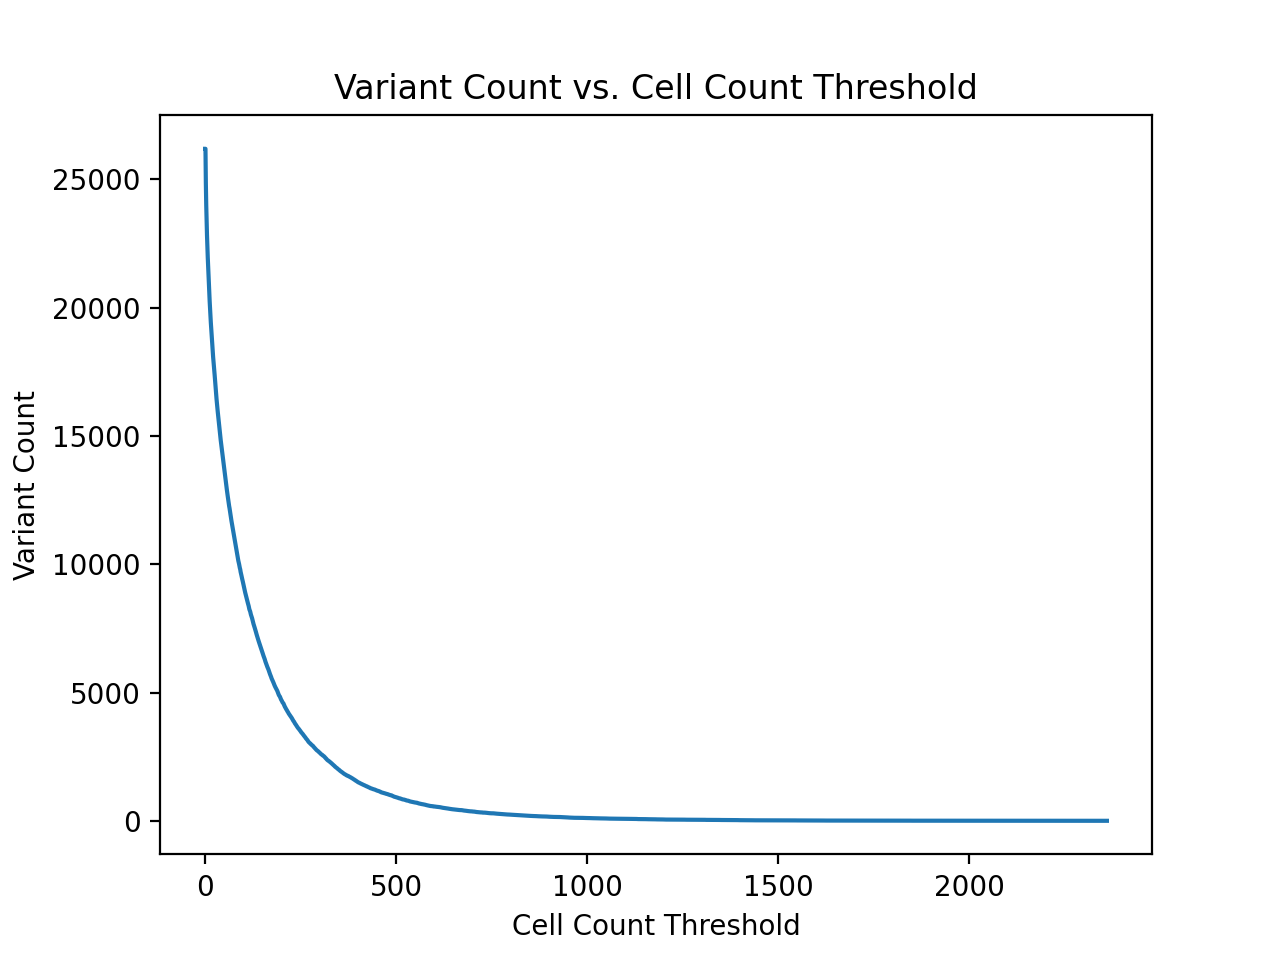
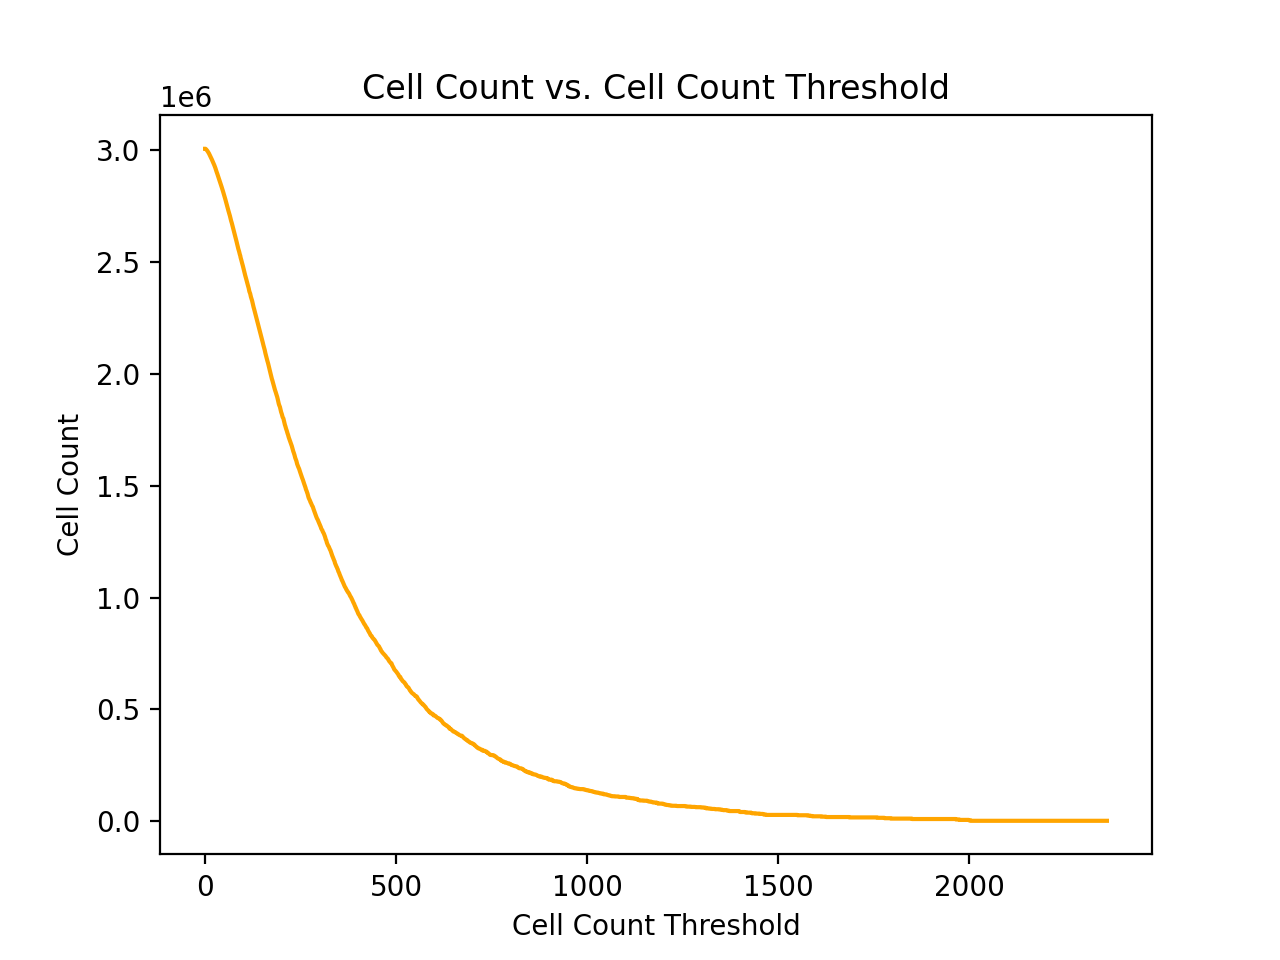
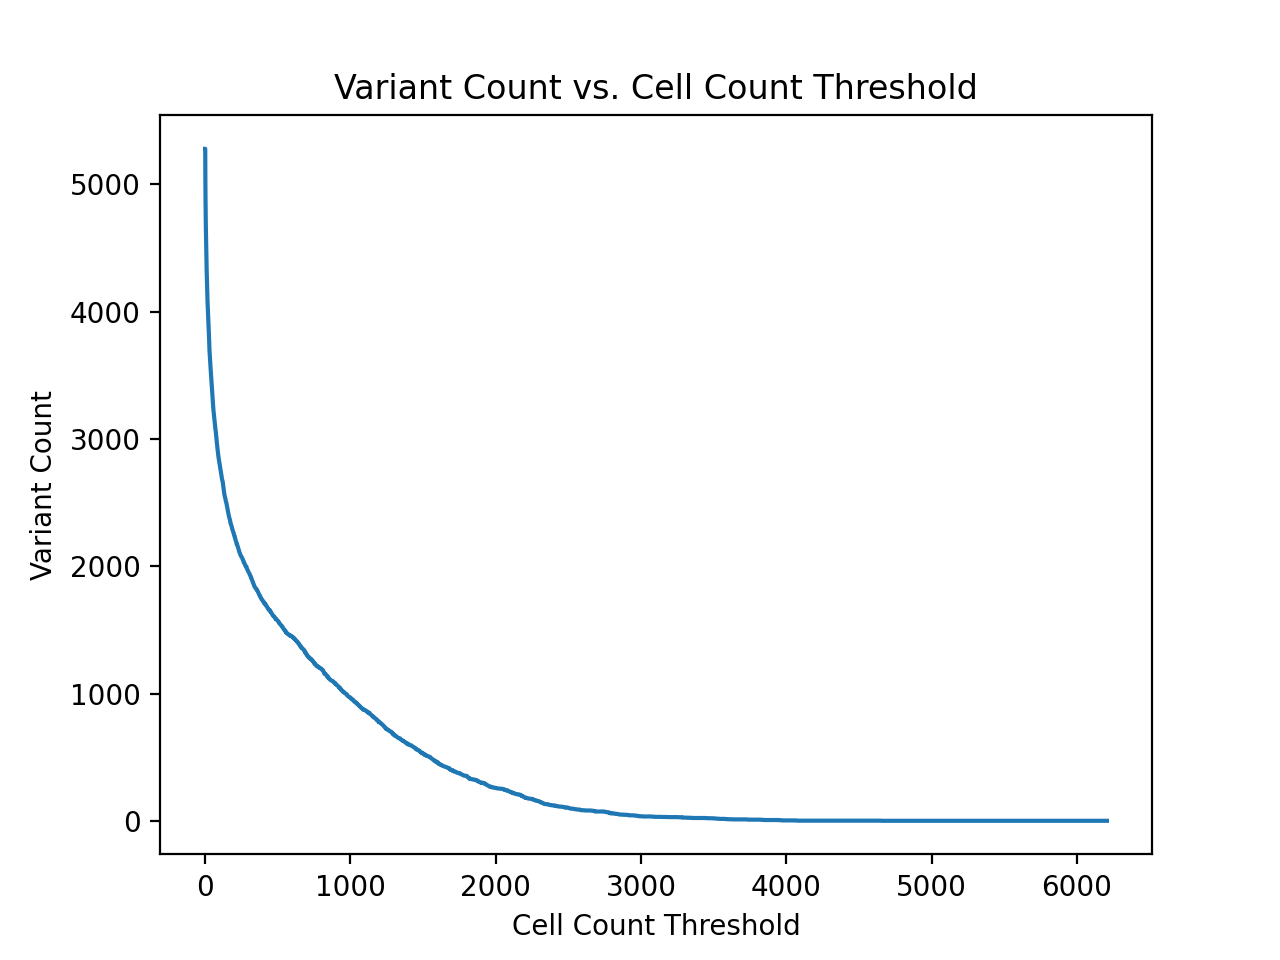
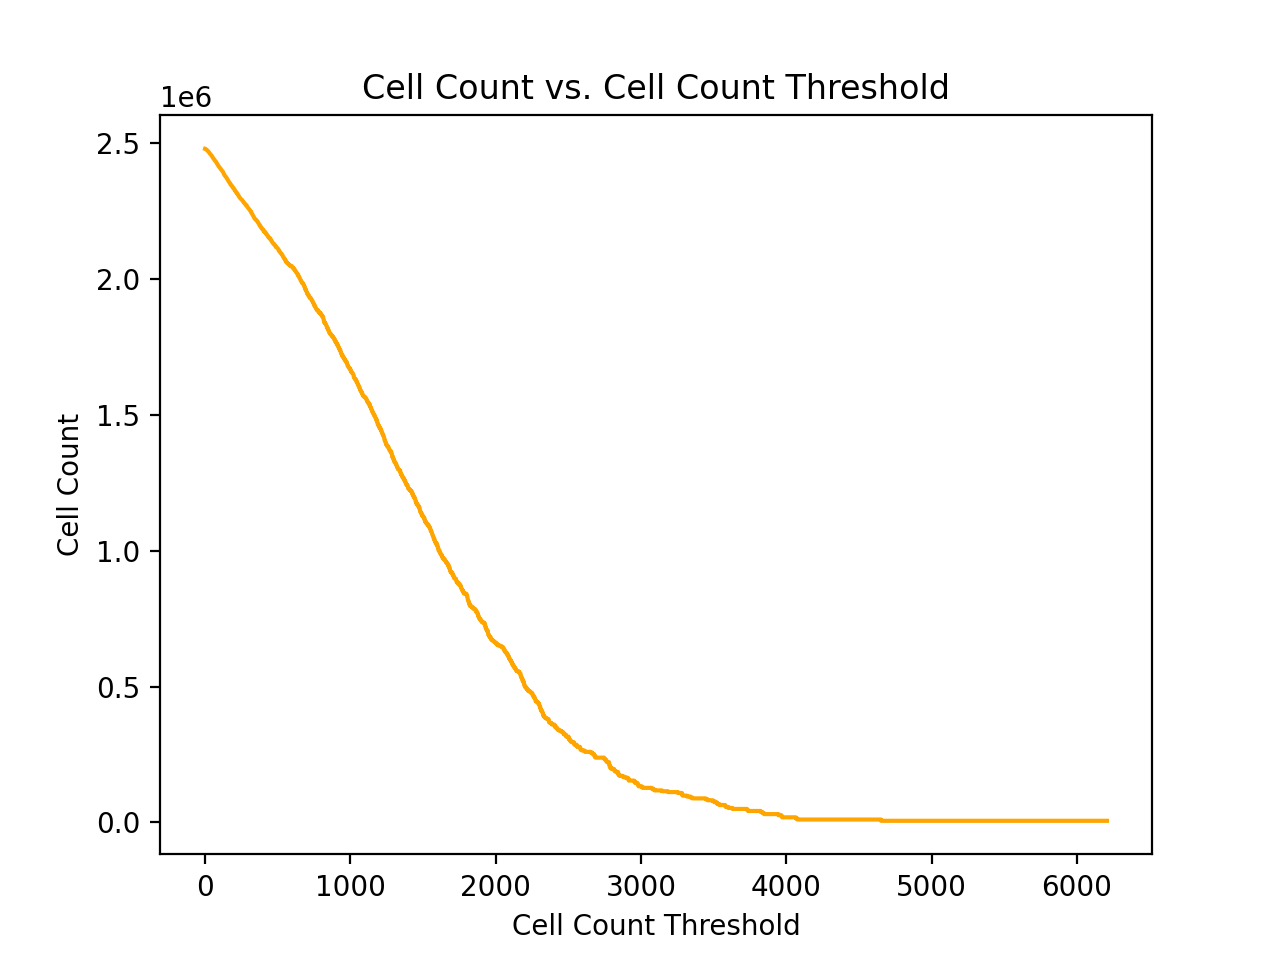
Next, in order to select the actual variant cell count threshold
I plotted the total variant count as well as the total cell count
over potential cell count thresholds. These graphs were generated
using fisseqtools.feature_selection
graph_cum_cell_variant_count.
A table of selected potential thresholds is also available below.
This table was also generated using
fisseqtools.feature_selection
            graph_cum_cell_variant_count
.
| Cell Count Threshold | Number of Variants | Number of Cells |
|---|---|---|
| 2361 | 1 | 2361 |
| 1440 | 21 | 35990 |
| 1283 | 42 | 64520 |
| 1159 | 64 | 90931 |
| 1058 | 87 | 116416 |
| 1004 | 108 | 138030 |
| 952 | 130 | 159396 |
| 911 | 155 | 182730 |
| 866 | 184 | 208434 |
| 829 | 216 | 235426 |
| 799 | 242 | 256534 |
| 768 | 272 | 279941 |
| 741 | 305 | 304846 |
| 712 | 340 | 330274 |
| 689 | 380 | 358324 |
| 666 | 420 | 385449 |
| 644 | 460 | 411601 |
| 621 | 513 | 445045 |
| 598 | 560 | 473760 |
| 576 | 626 | 512412 |
| 556 | 695 | 551384 |
| 535 | 765 | 589488 |
| 515 | 849 | 633556 |
| 494 | 950 | 684432 |
| 474 | 1054 | 734804 |
From the table above, a cell count threshold of 500 seems like a reasonable choice. Unfortunately the cell embeddings contain 1536 total features (4 channels x 384 features), so it is not possible to select a threshold that will allow the training of a great classifier for each potential variant of interest. However, an algorithm like random forest or logistic regression should be able to select out the important features.
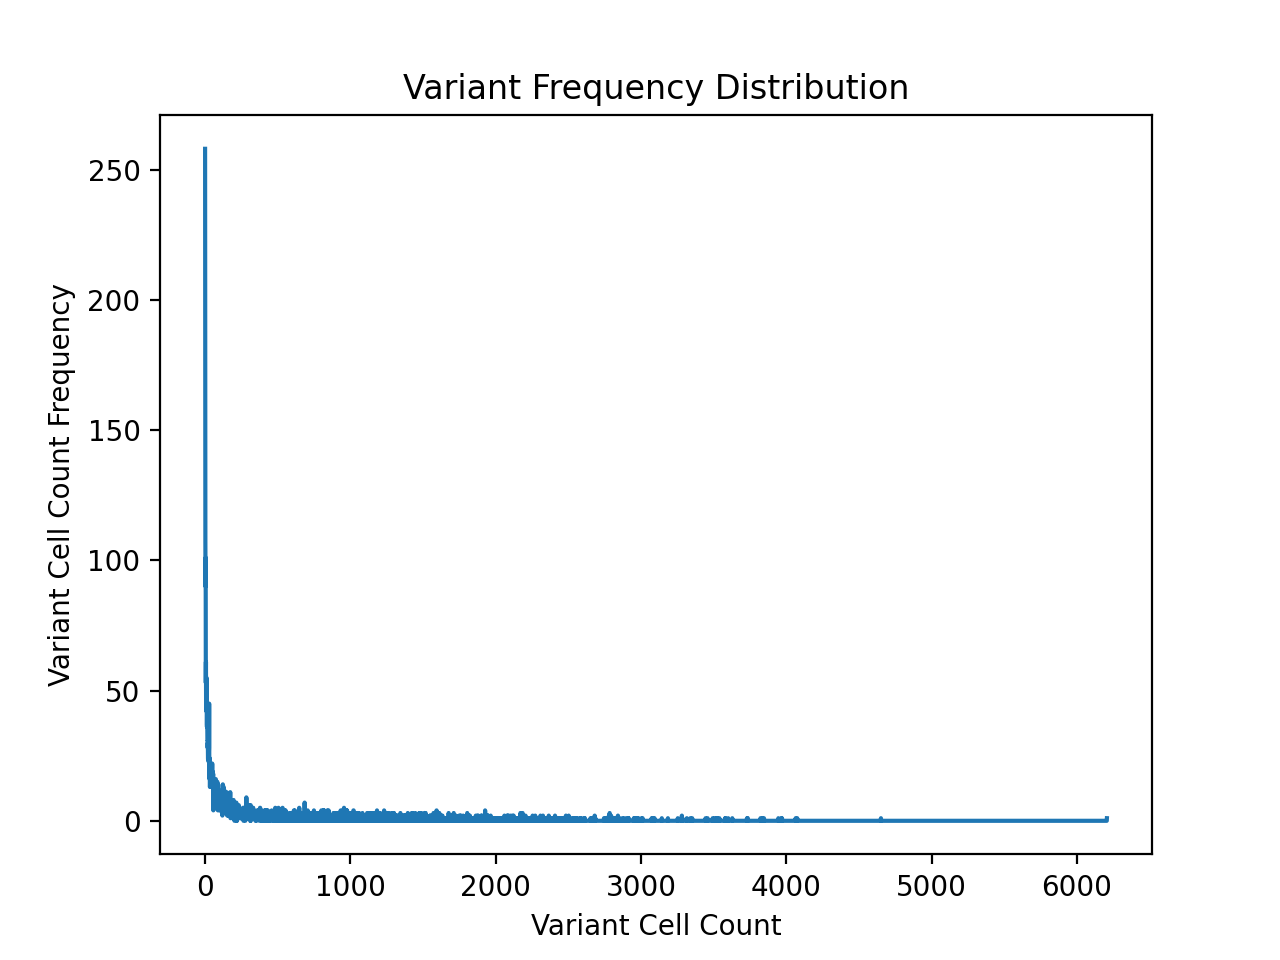
Repeating the Analysis, but with Genotype this Time (Oops)
Turns out the barcodes don't correspond one to one to the genotype
as I initially thought, whoops. Therefore, made some slight
modifications to fisseqtools.feature_selection and
repeated the previous analysis. I also filtered out any wildtype
and synonymous genotypes from the analysis this time around.
| Cell Count Threshold | Number of Variants | Number of Cells |
|---|---|---|
| 6207 | 1 | 6207 |
| 3316 | 26 | 98747 |
| 2847 | 52 | 177338 |
| 2615 | 83 | 262752 |
| 2467 | 110 | 331035 |
| 2328 | 137 | 395527 |
| 2267 | 165 | 459930 |
| 2182 | 196 | 528687 |
| 2107 | 226 | 593029 |
| 2014 | 256 | 655130 |
| 1936 | 285 | 712106 |
| 1868 | 319 | 776747 |
| 1801 | 352 | 836951 |
| 1729 | 382 | 889836 |
| 1670 | 418 | 950931 |
| 1614 | 446 | 996831 |
| 1562 | 489 | 1065073 |
| 1514 | 519 | 1111266 |
| 1463 | 558 | 1169295 |
| 1422 | 593 | 1219704 |
| 1368 | 627 | 1266912 |
| 1320 | 660 | 1311228 |
| 1276 | 704 | 1368266 |
| 1233 | 742 | 1415759 |
| 1196 | 779 | 1460715 |
In addition to the counts above, there are also 390283 wild type samples in the dataset, which is far more samples than any single non-synonymous variant. From the table above, a cell/sample threshold count of 2000 seems like a reasonable choice.